

12 stakeholder interviews, VOC analysis, Claude.ai transcript synthesis
3 personas, journey mapping, HMW statements, impact–effort matrix
Single workspace, real-time validation, 80+ component design system
Figma hi-fi prototype + Lovable live demo for exec stakeholders
8 billing specialists, 2 moderated sessions, post-launch metrics
Understanding the Claims Chaos
Conducted 12 stakeholder interviews with billing specialists, practice managers, and insurance coordinators. Used Claude.ai to synthesise 40+ hours of interview transcripts into structured insight clusters. Ran VOC analysis to identify top pain points: a 34% claim rejection rate due to coding errors, a fragmented multi-screen workflow requiring 11 clicks per submission, and zero real-time validation feedback.
Framing the Problem Space
Created 3 user personas — the Billing Specialist, the Practice Manager, and the Compliance Officer — each with distinct goals and frustrations. Mapped a current-state journey exposing 6 critical failure points where claims fell through. Defined the design challenge: "How might we give billing teams real-time confidence at every step of a claim's lifecycle — from entry to adjudication — without requiring retraining?" Prioritised features on an impact-effort matrix with product and engineering leads.
Redesigning the Claim Lifecycle
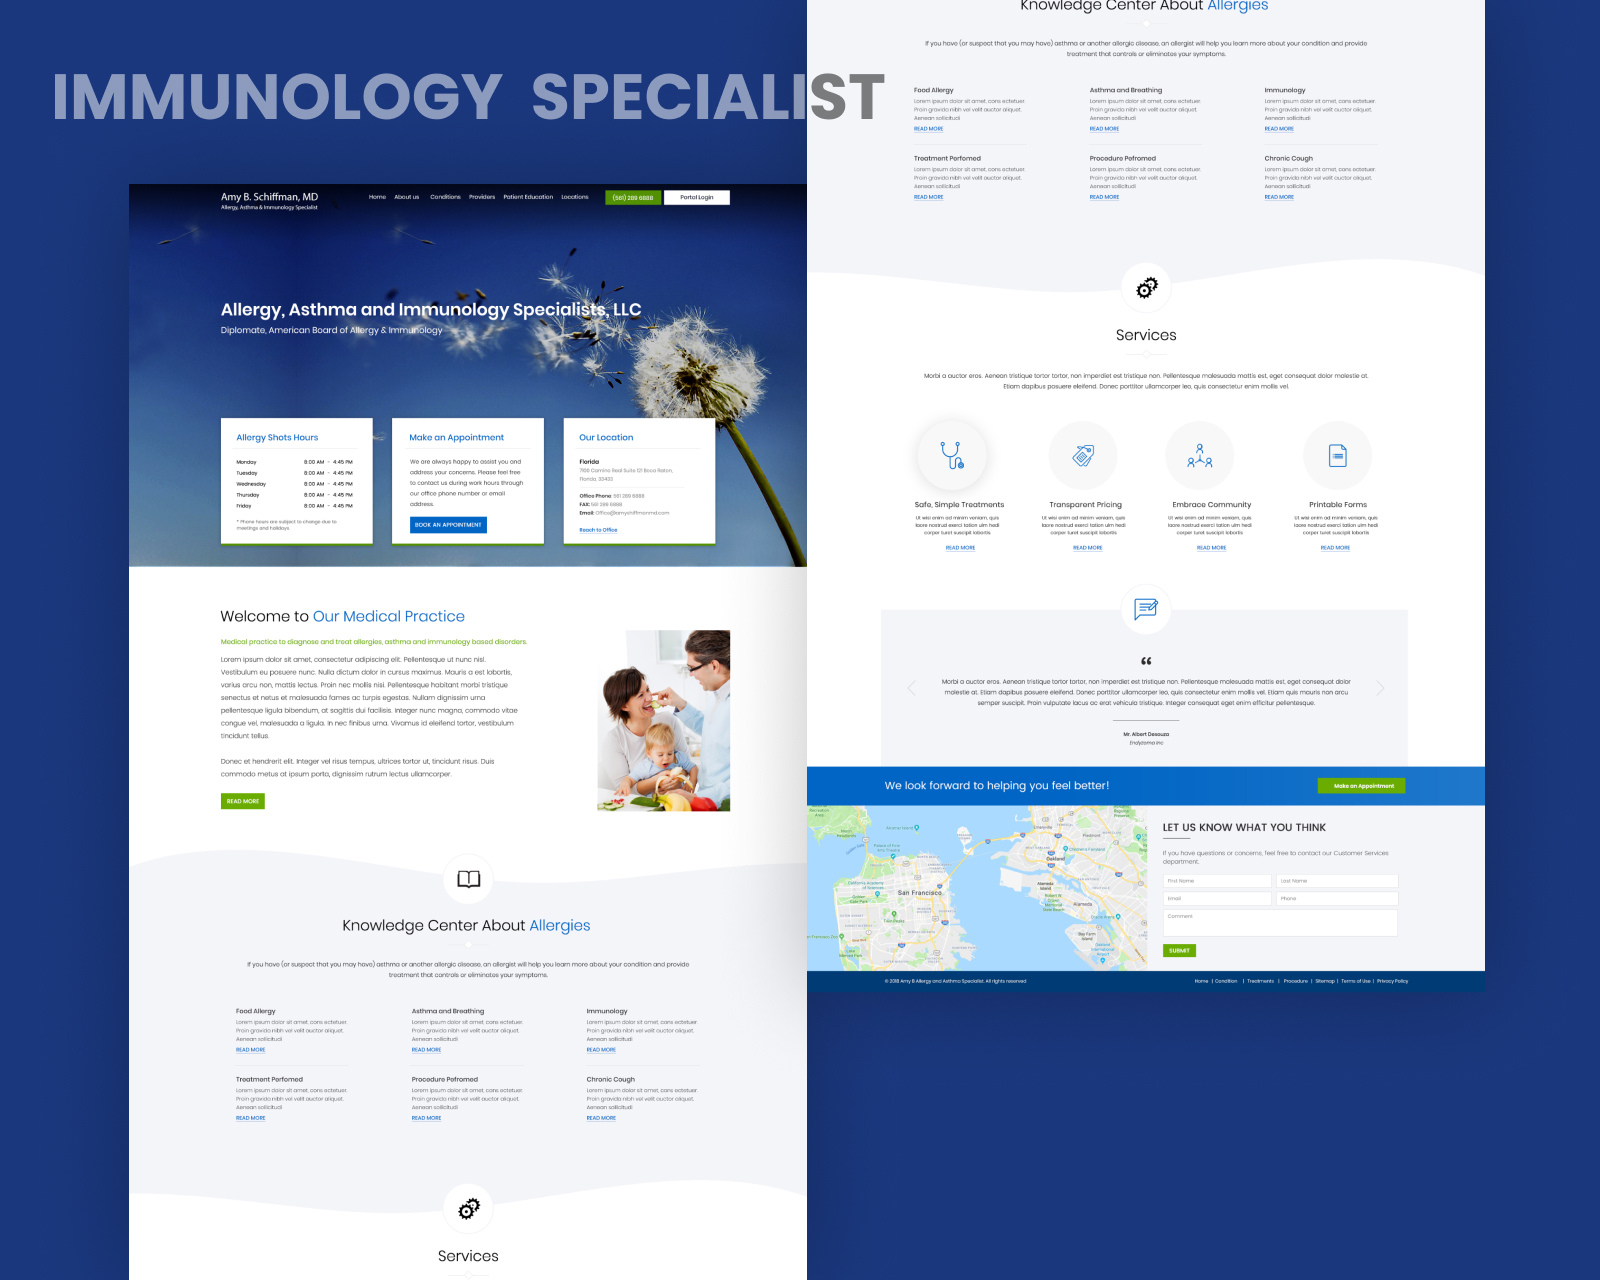
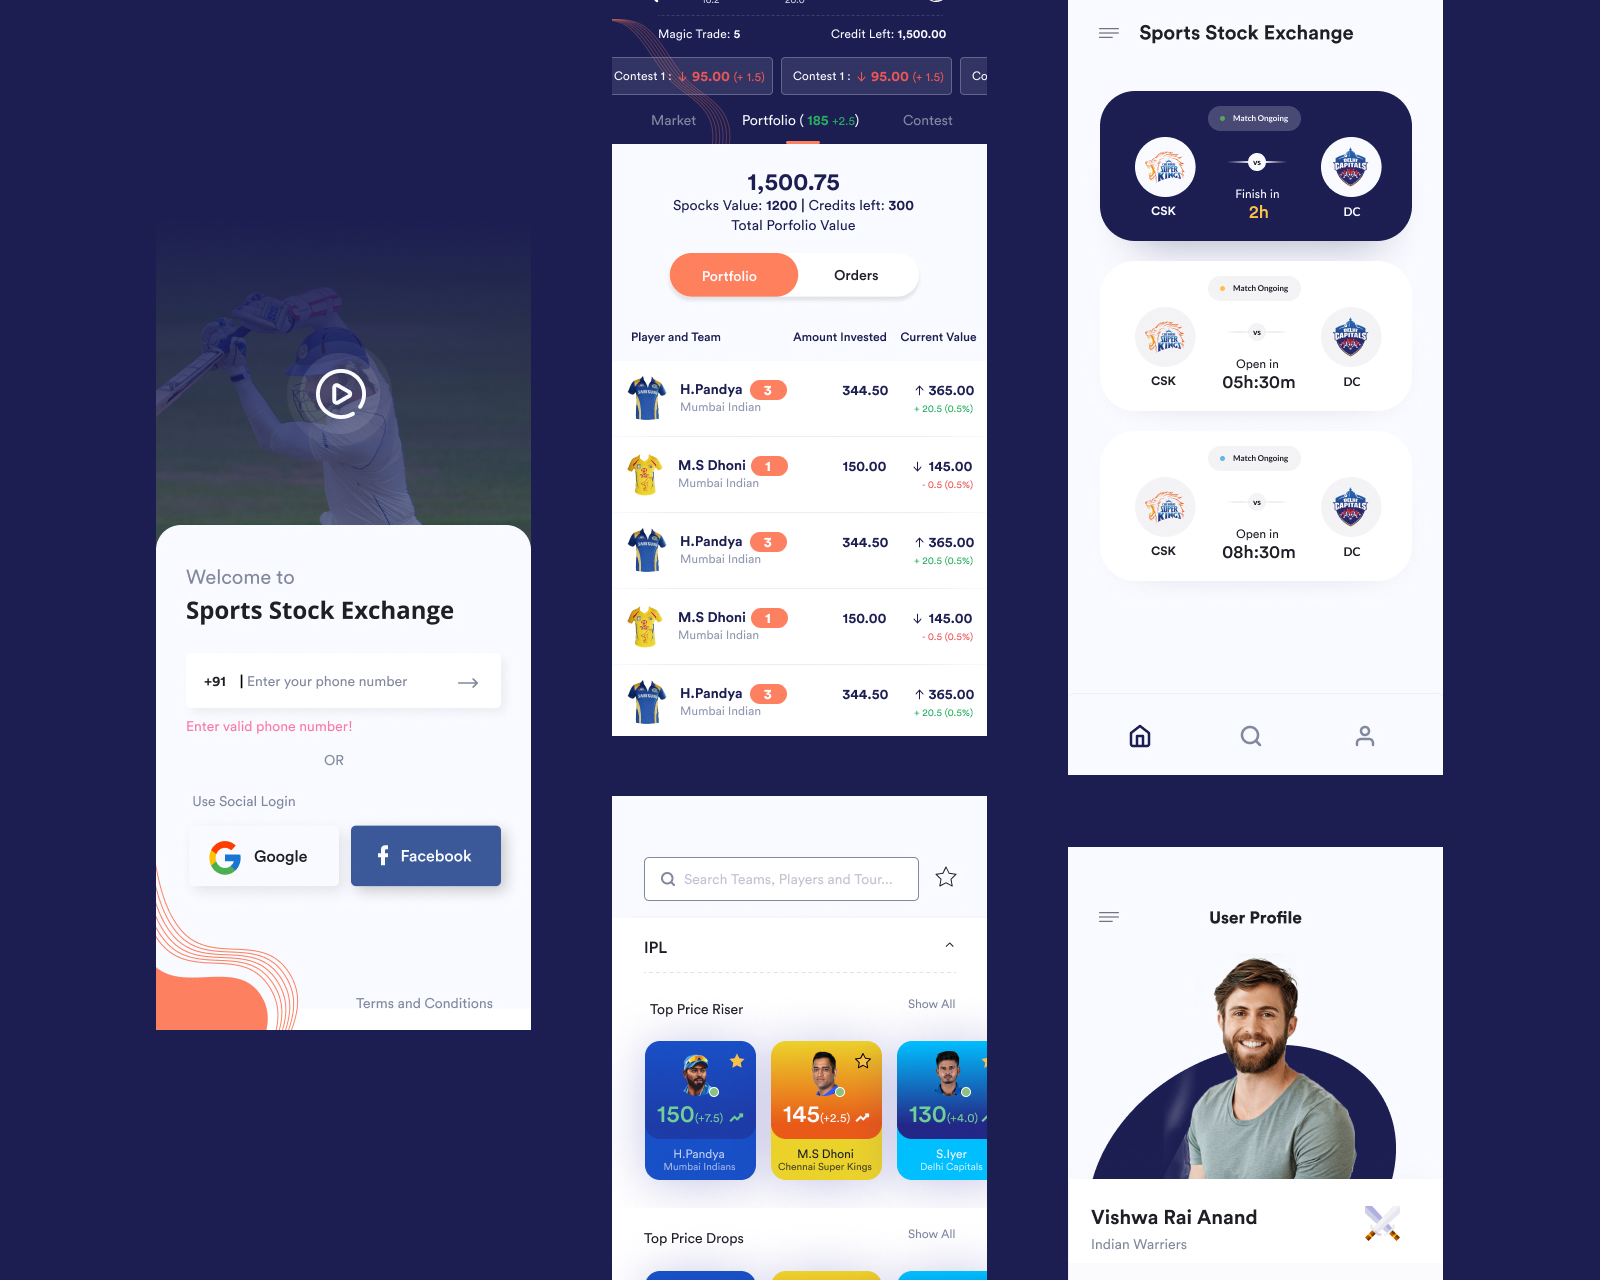
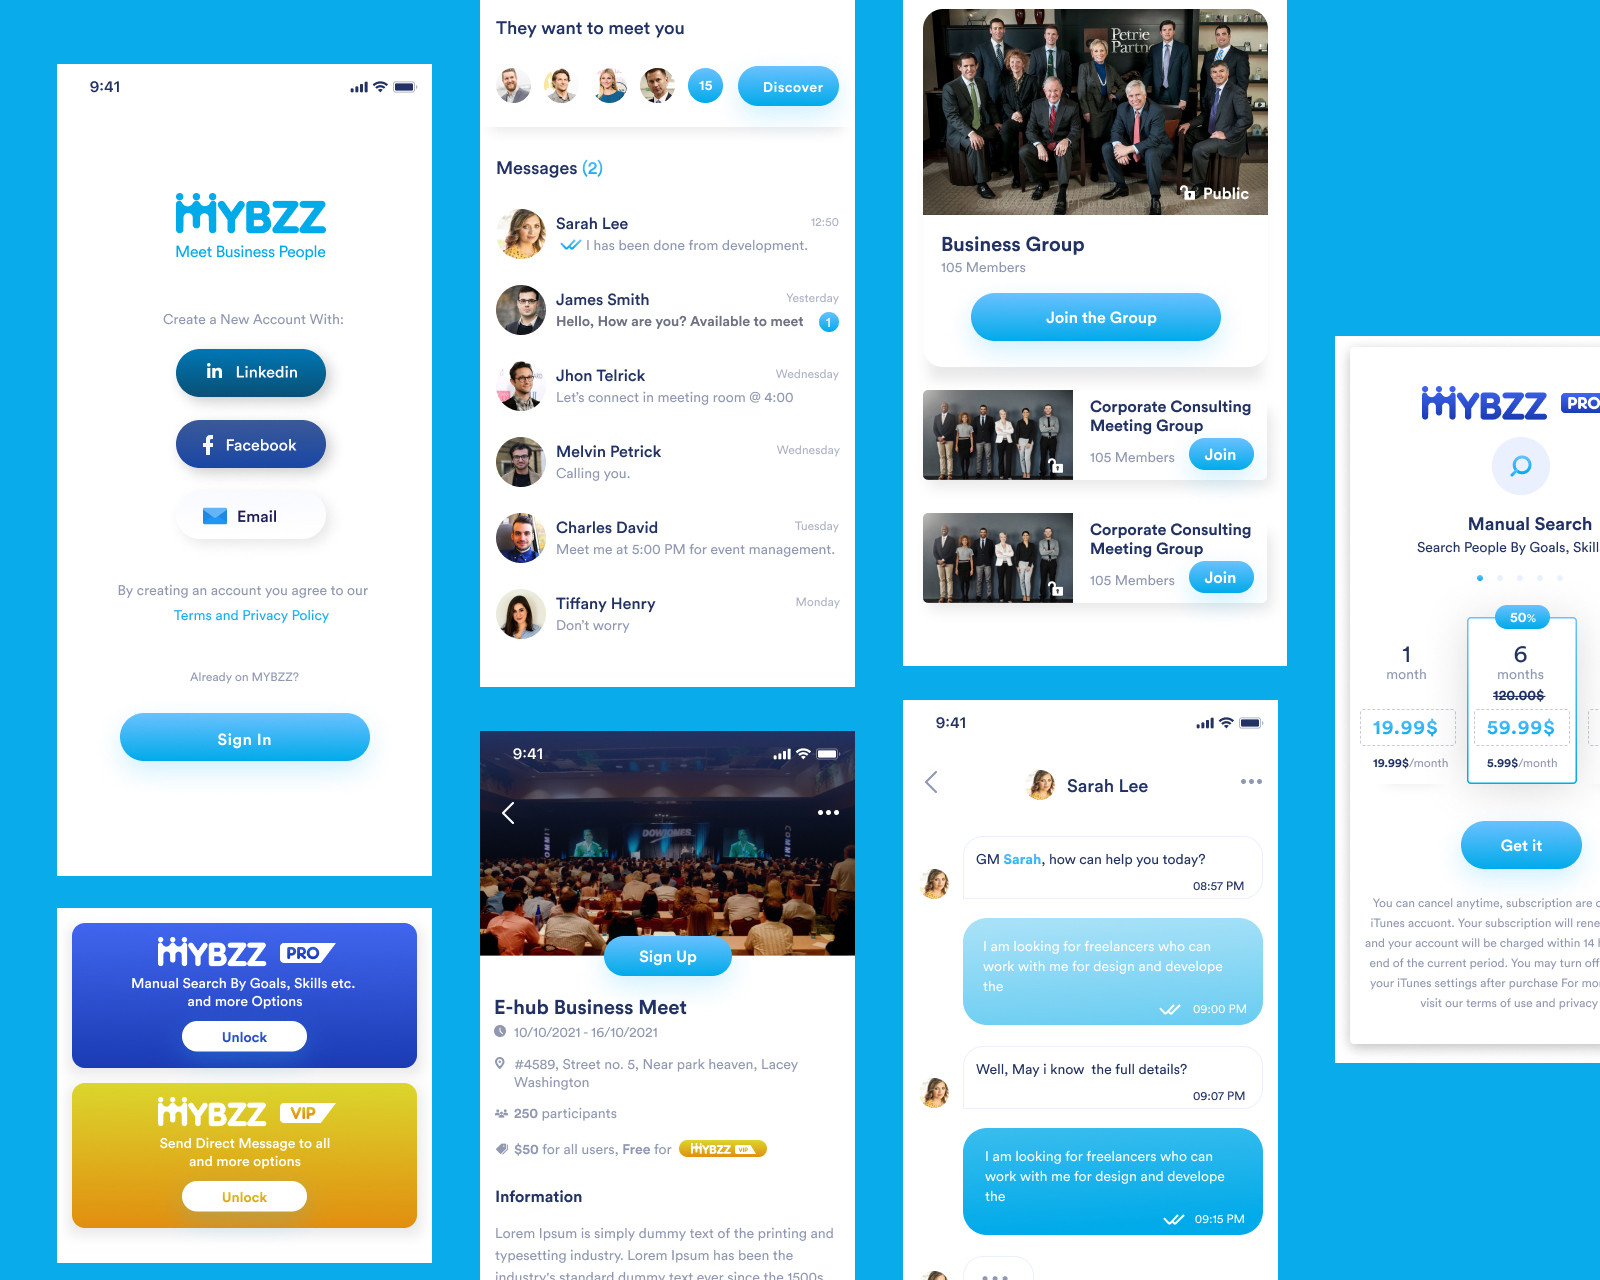
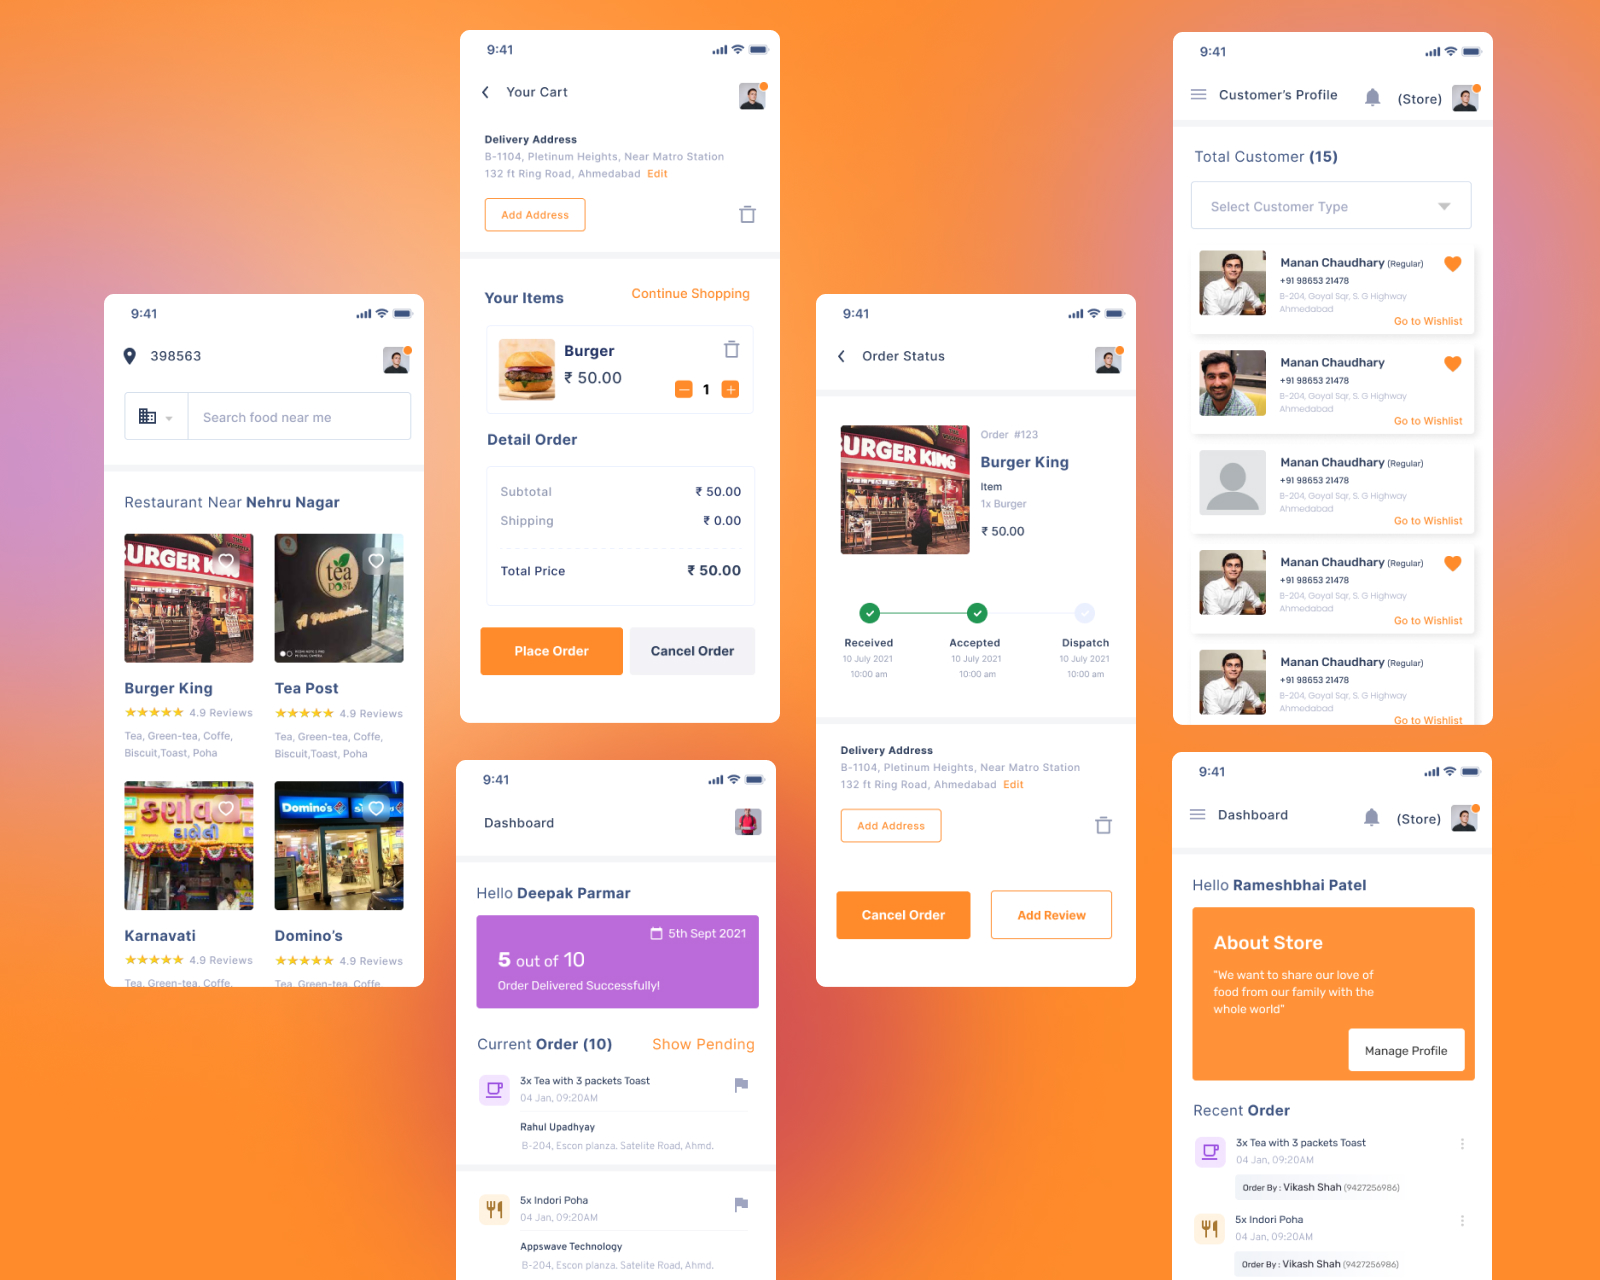
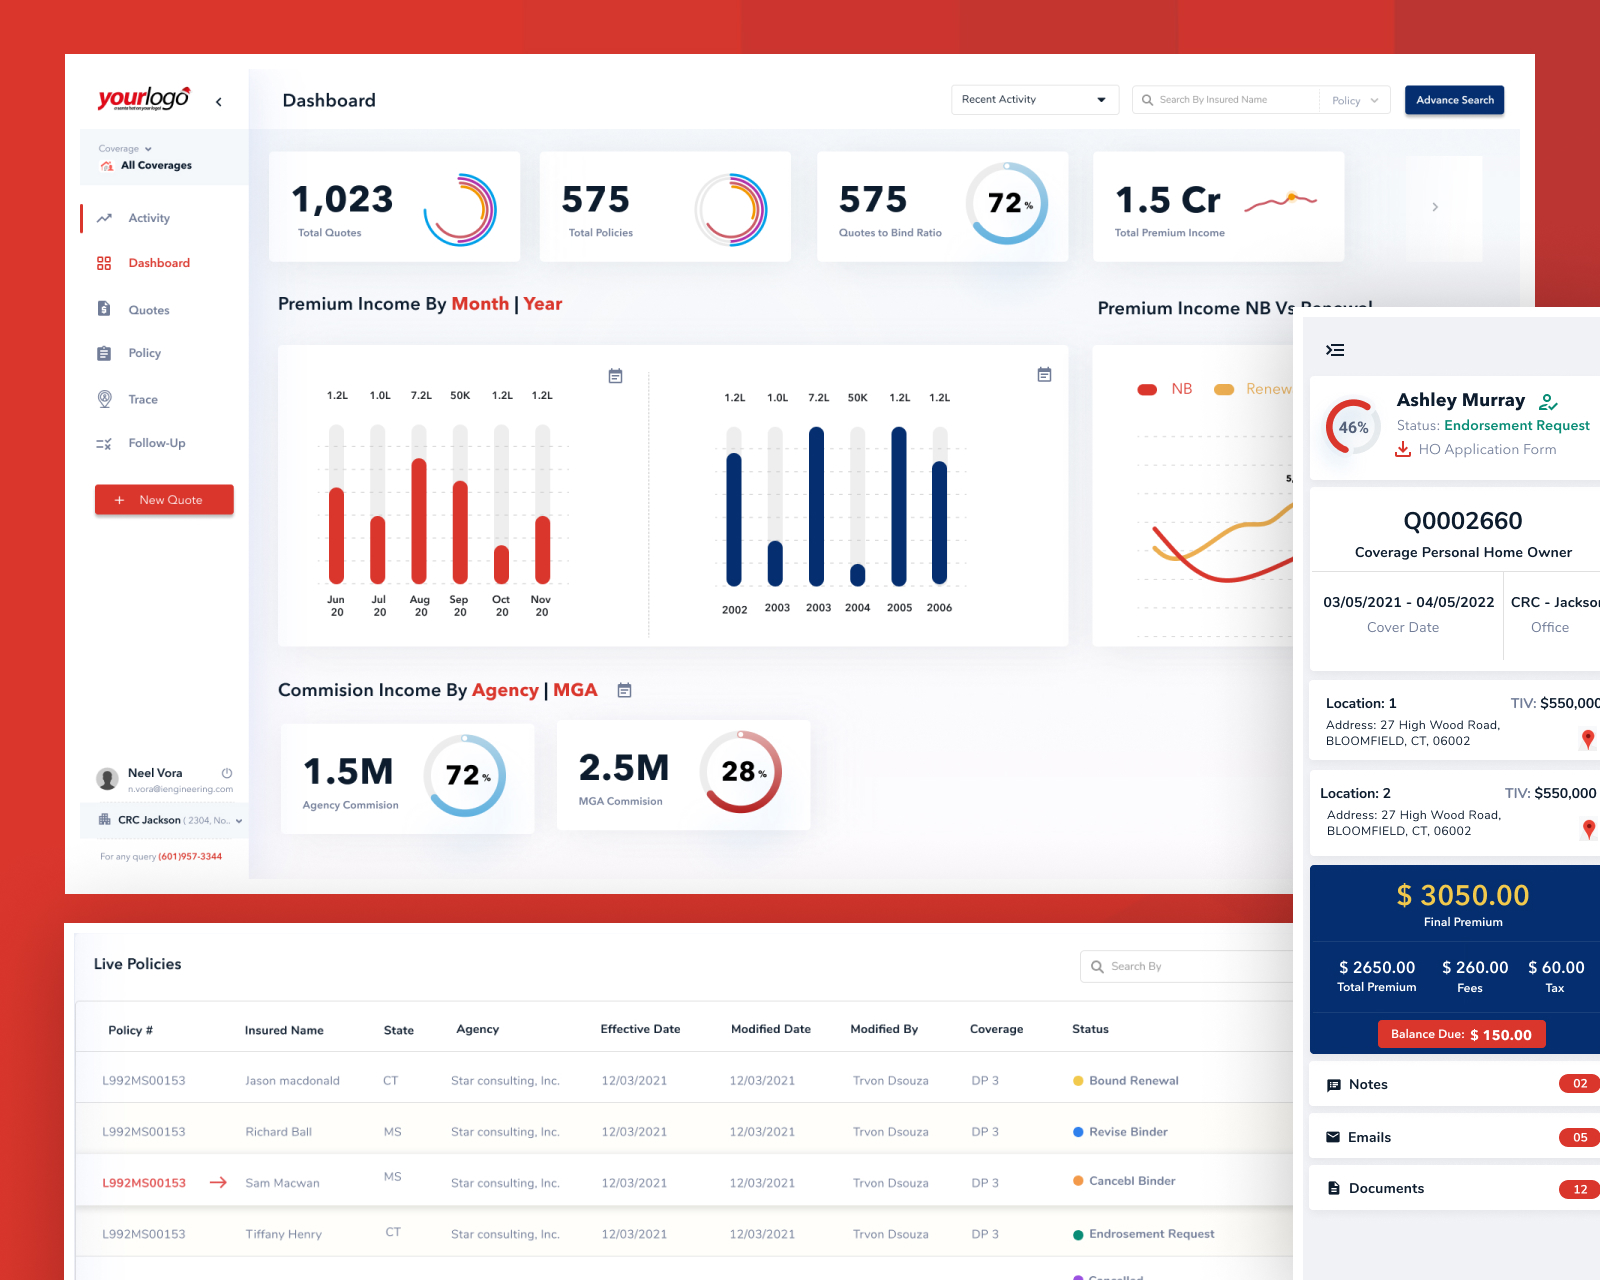
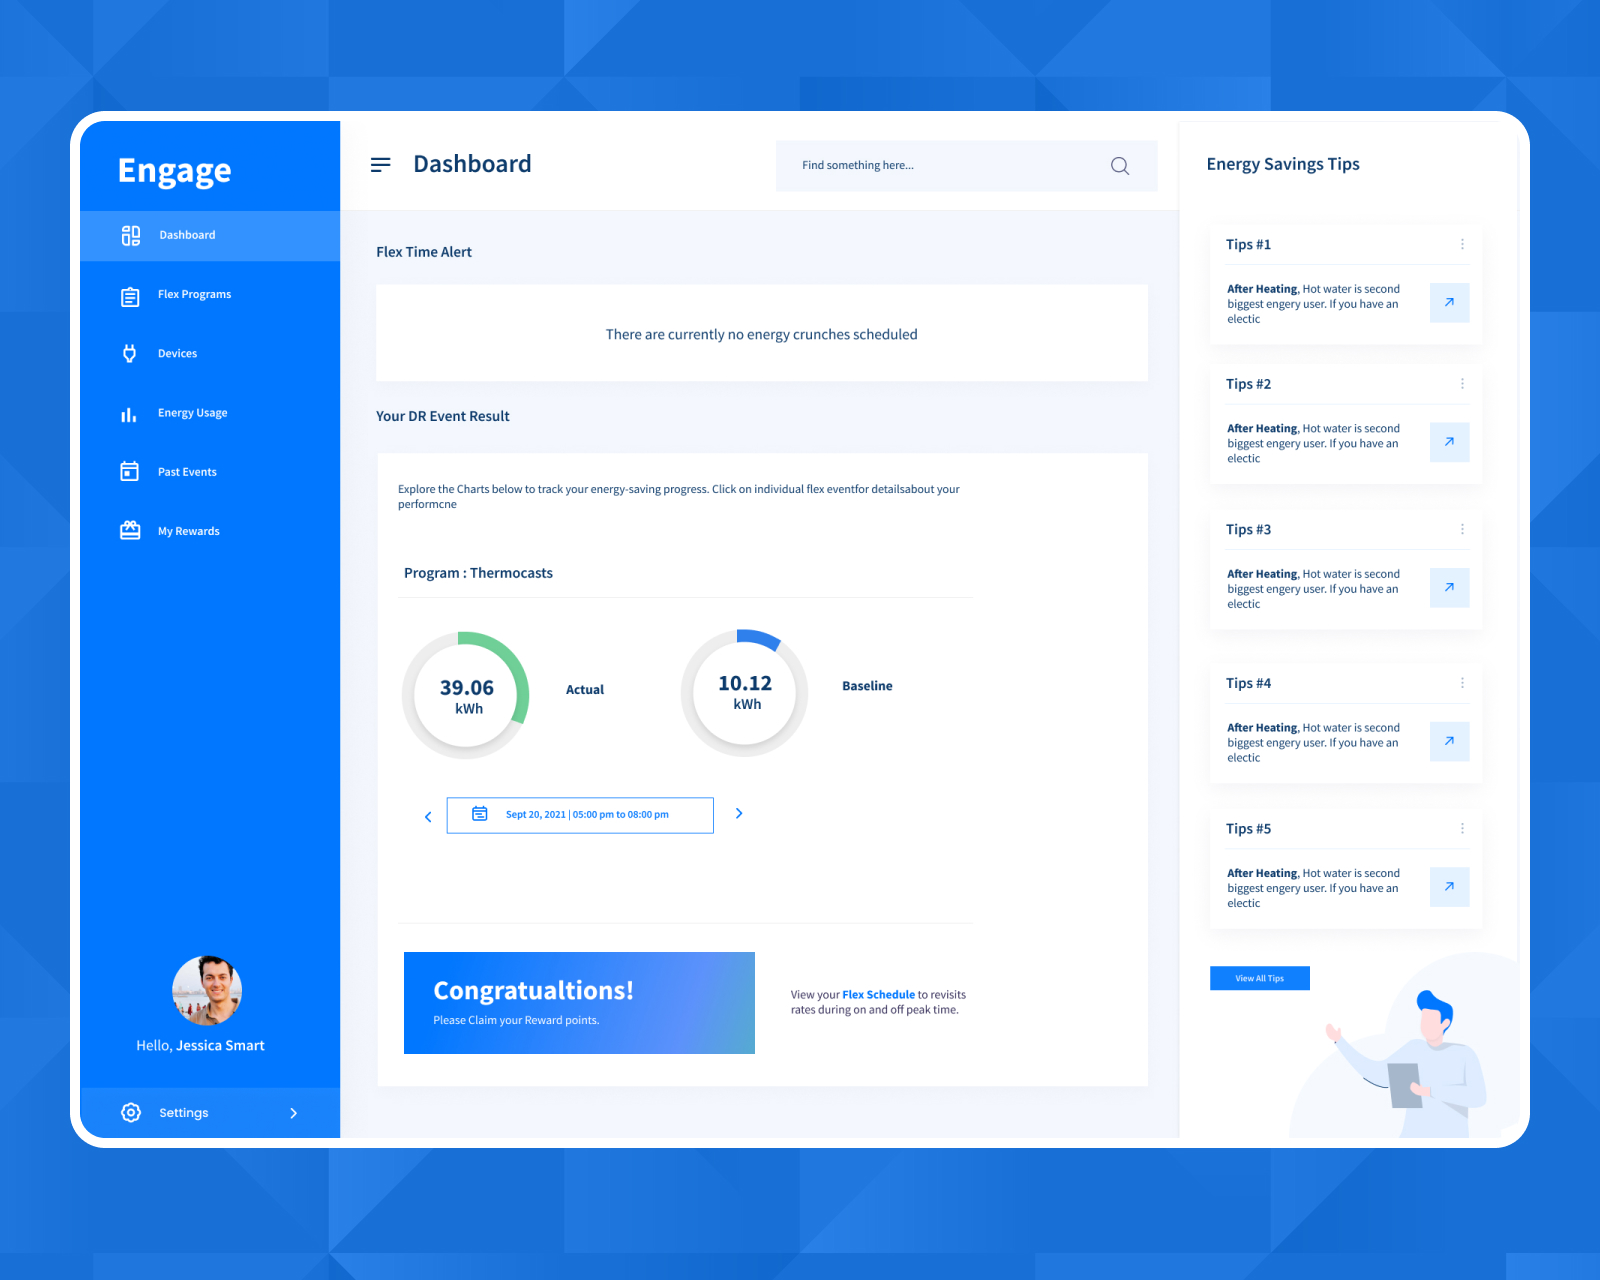
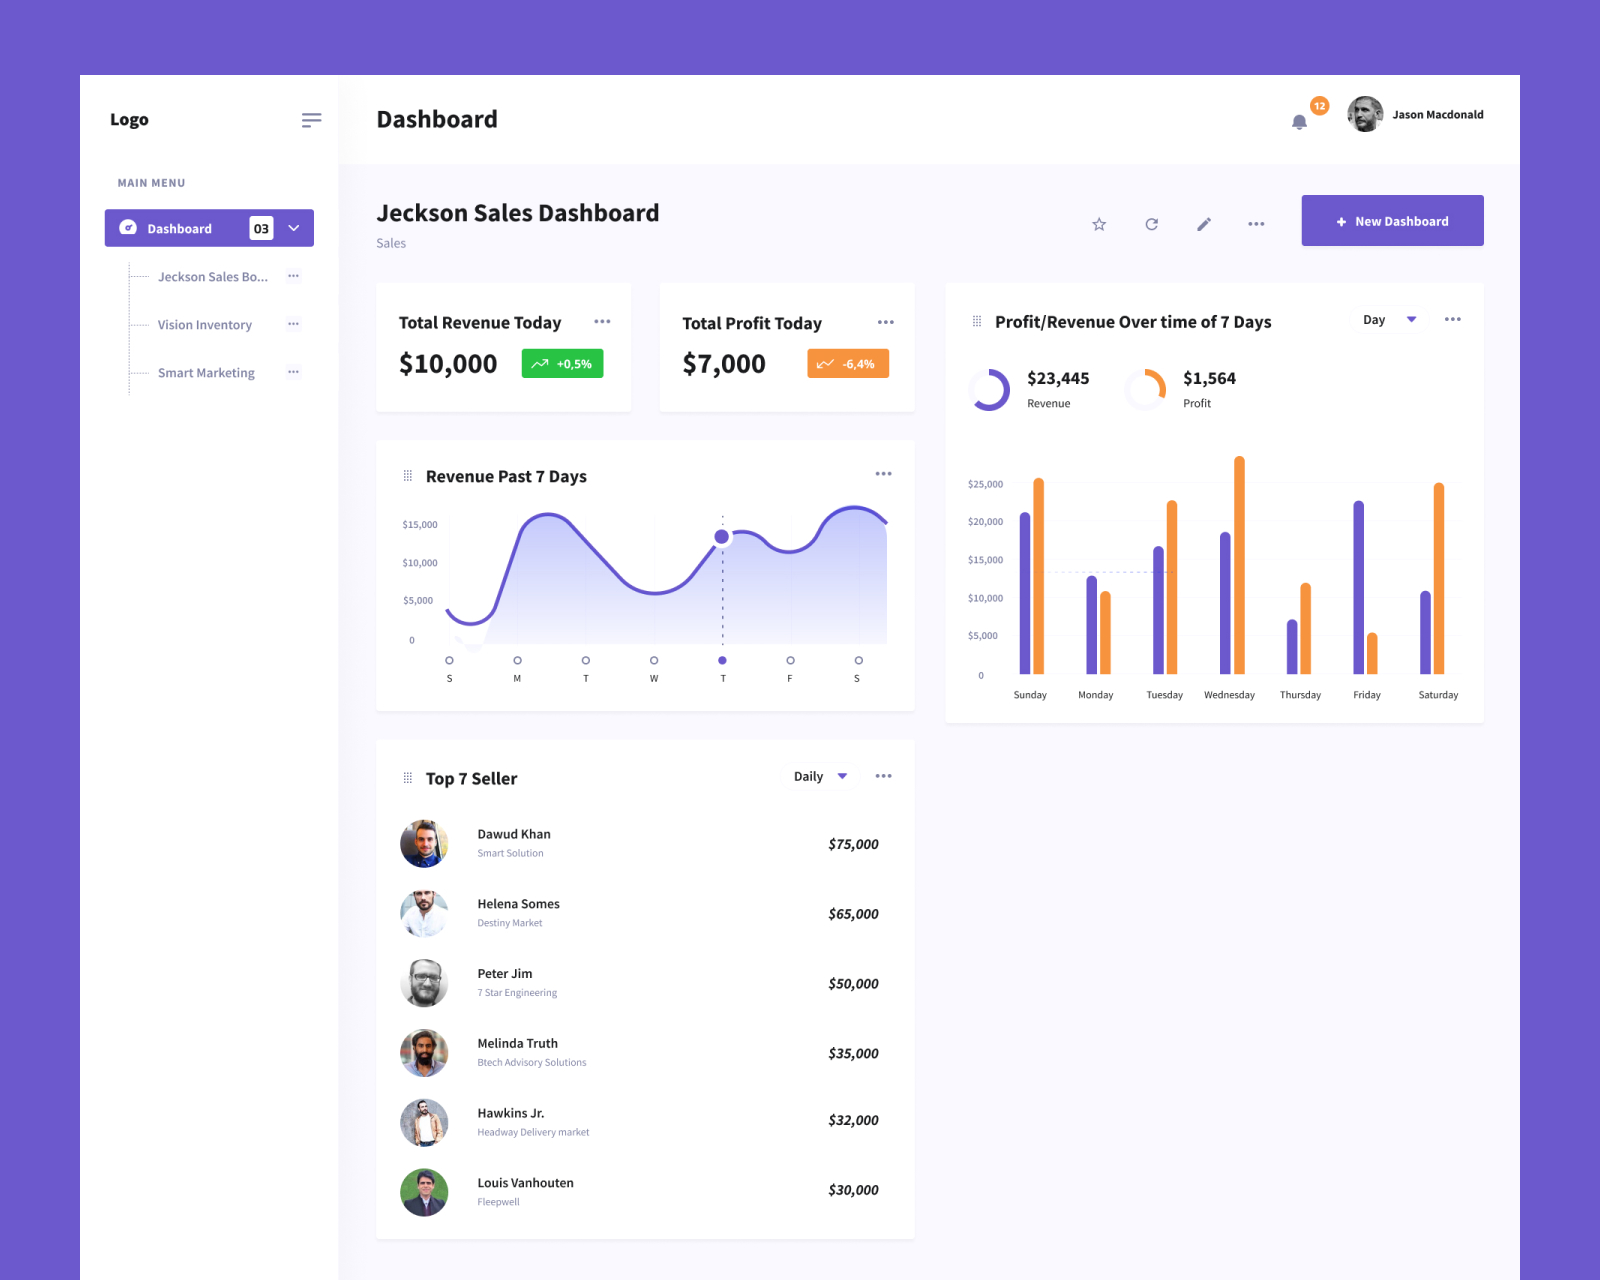
Consolidated 3 legacy screens into a single unified claim workspace with a contextual sidebar. Designed an inline ICD/CPT code validator with real-time error flagging before submission. Built a claim timeline component showing adjudication status at a glance. Used Claude.design and Figma Make to rapidly generate layout alternatives and validate information hierarchy. Delivered a full design system in Figma with 80+ reusable components documented in Storybook for seamless developer handoff.
Interactive Prototyping & Stakeholder Validation
Built a high-fidelity clickthrough prototype in Figma covering 5 core flows: new claim entry, claim edit & resubmission, batch processing, ERA reconciliation, and dashboard reporting. Used Lovable to create a live coded prototype for executive demos — enabling non-technical stakeholders to interact with the real UI in a browser. Ran 3 rounds of internal review with product, engineering, and compliance, iterating on the status workflow and notification system each cycle.
Usability Testing & Measurable Impact
Conducted moderated usability testing with 8 billing specialists across 2 sessions. Measured task completion rate, time-on-task, and error rate for the claim submission flow. Post-launch metrics showed dramatic improvement — claim submission time dropped from 4.2 minutes to 1.8 minutes, the rejection rate fell by 22 percentage points in the first quarter, and CSAT rose from 54 to 81. The redesign became the foundation for a platform-wide design system rollout.